Android Profiling Introduction
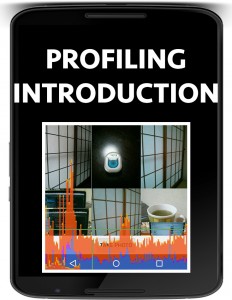
Introduction to the android profiling tutorial series where a number of android image loading libraries are profiled and compared.
The android profiling introduction is a new android video tutorial series whose aim is to highlight any differences between the android image loading libraries.
There are a number of high quality android image loading libraries provided and the intention of this tutorial series is to support android developers in their selection process for which android image loading library will best suit their needs.
INTRODUCTION TO THE PROFILING TOOLS
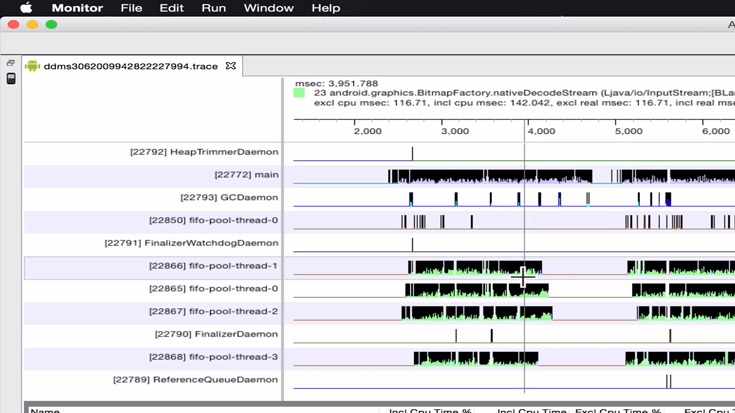
Traceview
Traceview is used to record method calls on various threads. This gives us insight into the activity on the main ui thread as well as the setup of the background threads and operations.
Memory Monitor

The android memory monitor tool will be used to identify the memory consumption used by the android image loading libraries.
The memory monitor tool gives us an indication of how much memory the android image loading library is consuming from starting, scrolling and then after triggering a garbage collection (GC) event.
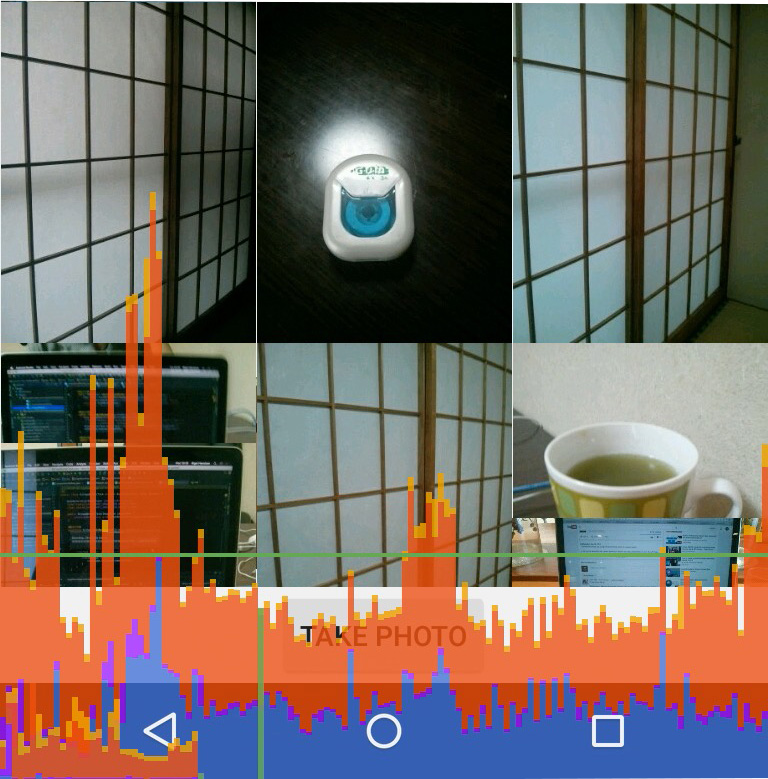
GPU Rendering
The android GPU rendering tool providing by the android device displays the amount of time takenfor a frame to be rendered on the display.
Note the horizontal green line which represents 16 ms, any frames that take longer may result in a user seeing stutter.
Wrapup
At the end of each video a summary of the observations made during the profiling is discussed.
