Profiling android glide loader library
In this review we spend time profiling android glide loader library using the traceview, memory monitor & GPU render profiling tools.

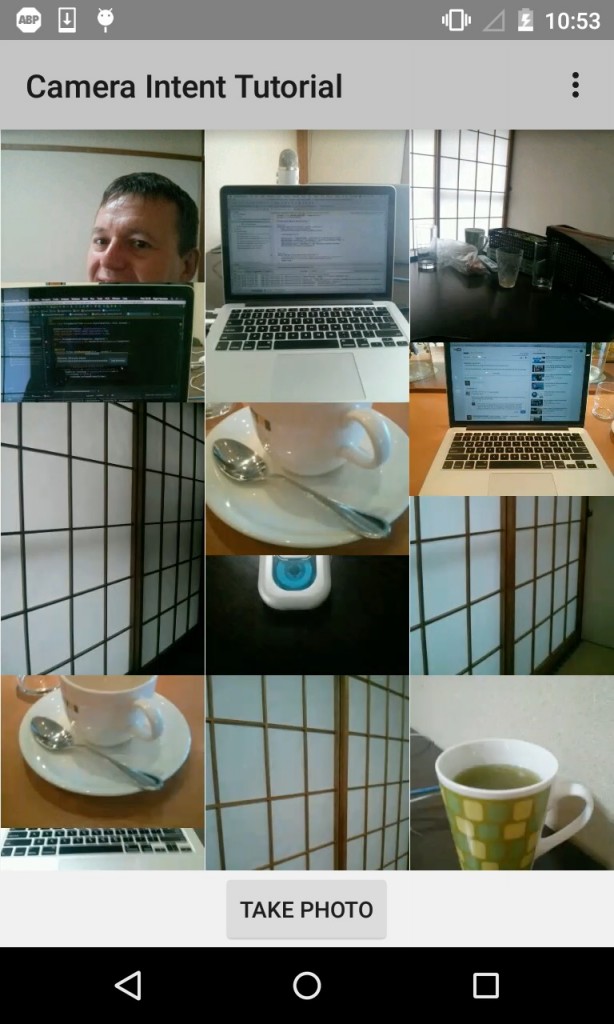
Review of running android performance profiling tools on a recyclerview grid gallery using the globe image loading library.
Results
TRACEVIEW
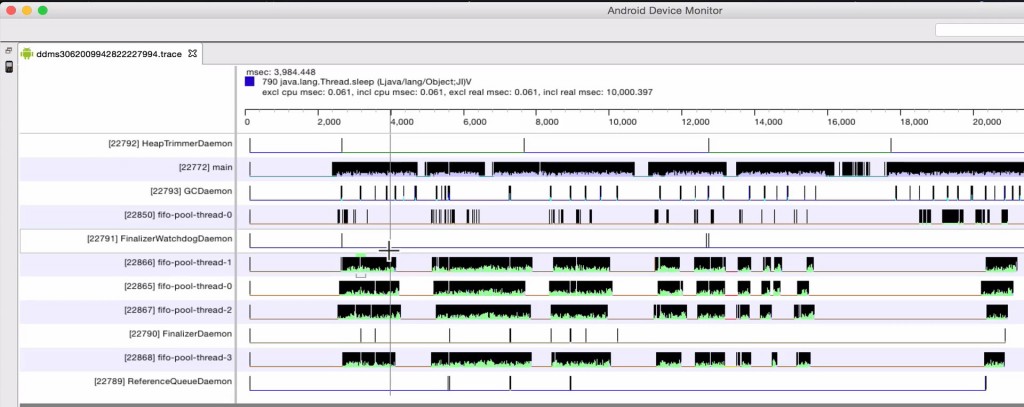
Here we observe four background threads all running at the same time resulting in much quicker image loading. Also note the lack of significant spaces in the main ui thread which translates into a good performance.
MEMORY MONITOR
Starts at consuming in the region of 10 MB, then after scrolling reaches a max in the region of 24 MB. After triggering a garbage collection (GC) the memory consumed drops down to 19.5 MB.
GPU RENDER
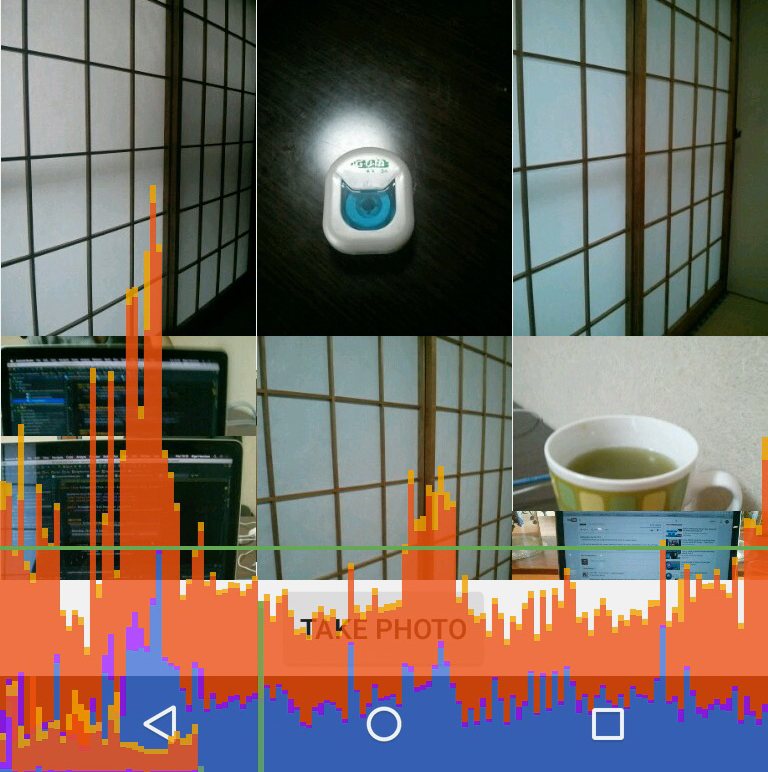
Running android device’s GPU render test on a recyclerview grid gallery using glide image loading library.
The key point to note here is the green horizontal line which represents 16 ms. Any frames that are higher than the horizontal green line can result in application jitter.
Note at the left hand side there are a number of sequential frames all taking longer than 16 ms to render.
Observed Issues
In the top left & centre thumbnails there is a corruption resulting in more than one image in the thumbnail.
Get Application Code
If you would like to run these tests on your own hardware the code is available on github here
https://github.com/mobapptuts/recyclerview_image_gallery.git Tag grid-gallery-glide
Or else you can run this command
git clone — branch grid-gallery-glide https://github.com/mobapptuts/recyclerview_image_gallery.git


