Profiling android fresco loader library
In this review we spend time profiling android fresco loader library using the traceview, memory monitor & GPU render profiling tools.
Results
TRACEVIEW
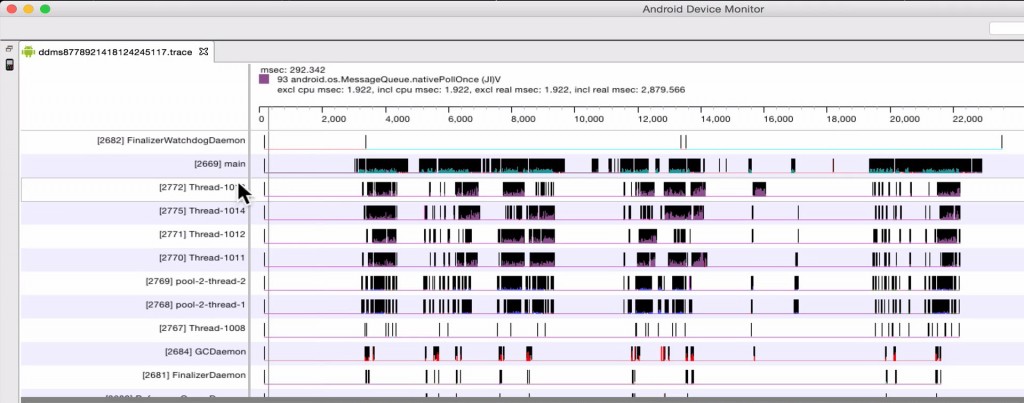
Here we observe four background threads loading the image files with no noticeable pauses in the UI thread.
It was noted that scrolling performance was good compared with the other image loading libraries.
MEMORY MONITOR
Starts at consuming in the region of 16 MB, then after scrolling reaches a max in the region of 153 MB. After triggering a garbage collection (GC) the memory consumed drops down to 46 MB.
The max levels of memory consumption are significantly higher than the other image libraries, which would explain the good scrolling perfomance.
GPU RENDER
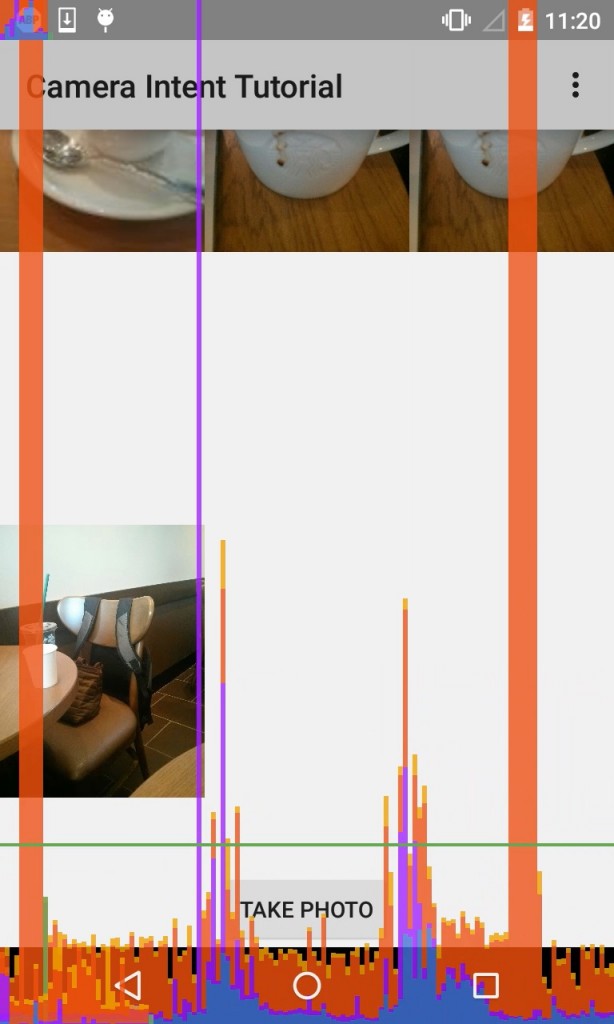
The key point to note here is the green horizontal line which represents 16 ms. Any frames that are higher than the horizontal green line can result in application jitter.
At certain times we are seeing significant delays in the rendering of frames in fact the GPU rendering tool has some frames and groups of frames off the scale.
Get Application Code
If you would like to run these tests on your own hardware the code is available on github here
https://github.com/mobapptuts/recyclerview_image_gallery.git Tag fresco
Or else you can run this command
git clone — branch fresco https://github.com/mobapptuts/recyclerview_image_gallery.git


