Profiling android recyclerview grid gallery
In this review we spend time profiling android recyclerview grid gallery using the traceview, memory monitor & GPU render profiling tools.
Results
TRACEVIEW

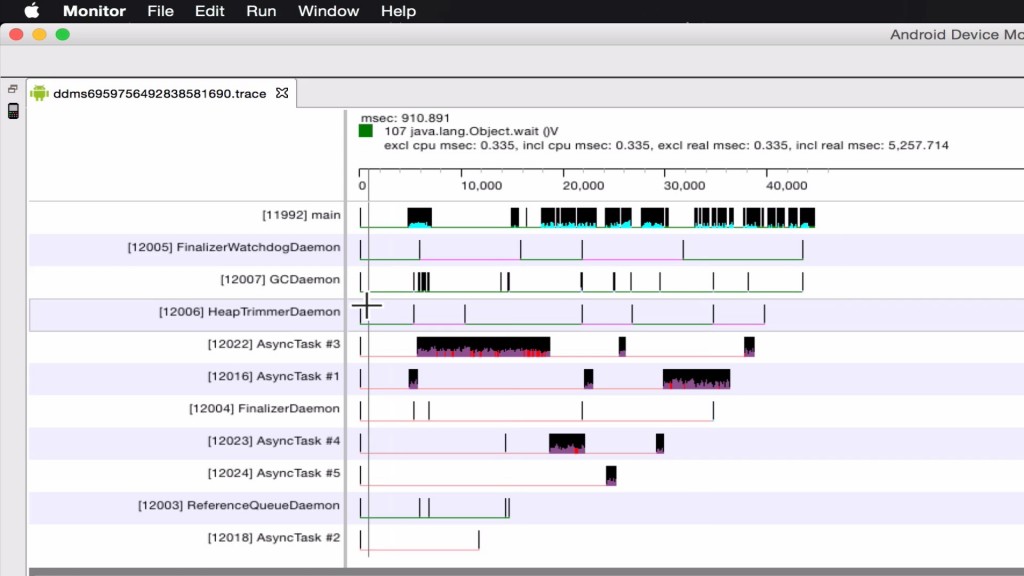
Android performance profiling results from the trace view tool on the android recyclerview grid gallery
From this chart we can observe that a android AsyncTask has been used to handle the bitmap loading which is not the best method for this type of application.
Note the gaps in the main thread which denotes that the user is waiting for the gallery to refresh while scrolling.
MEMORY MONITOR
Starts at consuming in the region of 13 MB, then after scrolling reaches a max in the region of 34 MB. After triggering a garbage collection (GC) the memory consumed drops down to 26 MB.
GPU RENDER
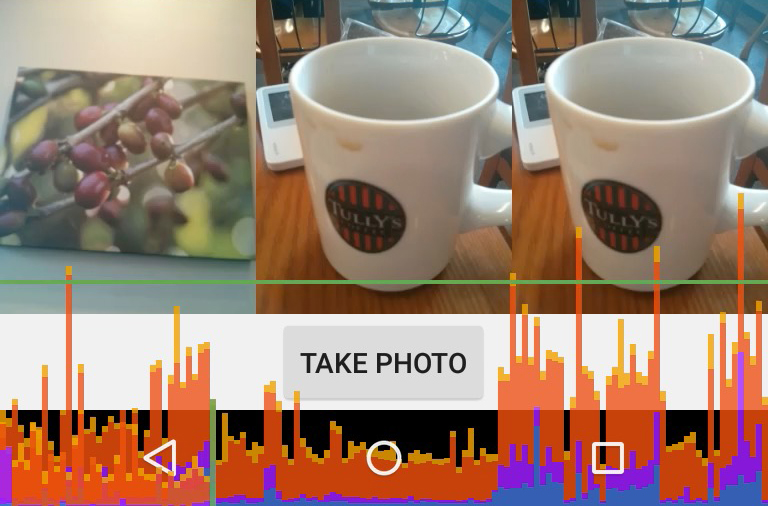
The key point to note here is the green horizontal line which represents 16 ms. Any frames that are higher than the horizontal green line can result in application jitter.
Get Application Code
If you would like to run these tests on your own hardware the code is available on github here
https://github.com/mobapptuts/recyclerview_image_gallery.git Tag inBitmap
Or else you can run this command
git clone — branch inBitmap https://github.com/mobapptuts/recyclerview_image_gallery.git


